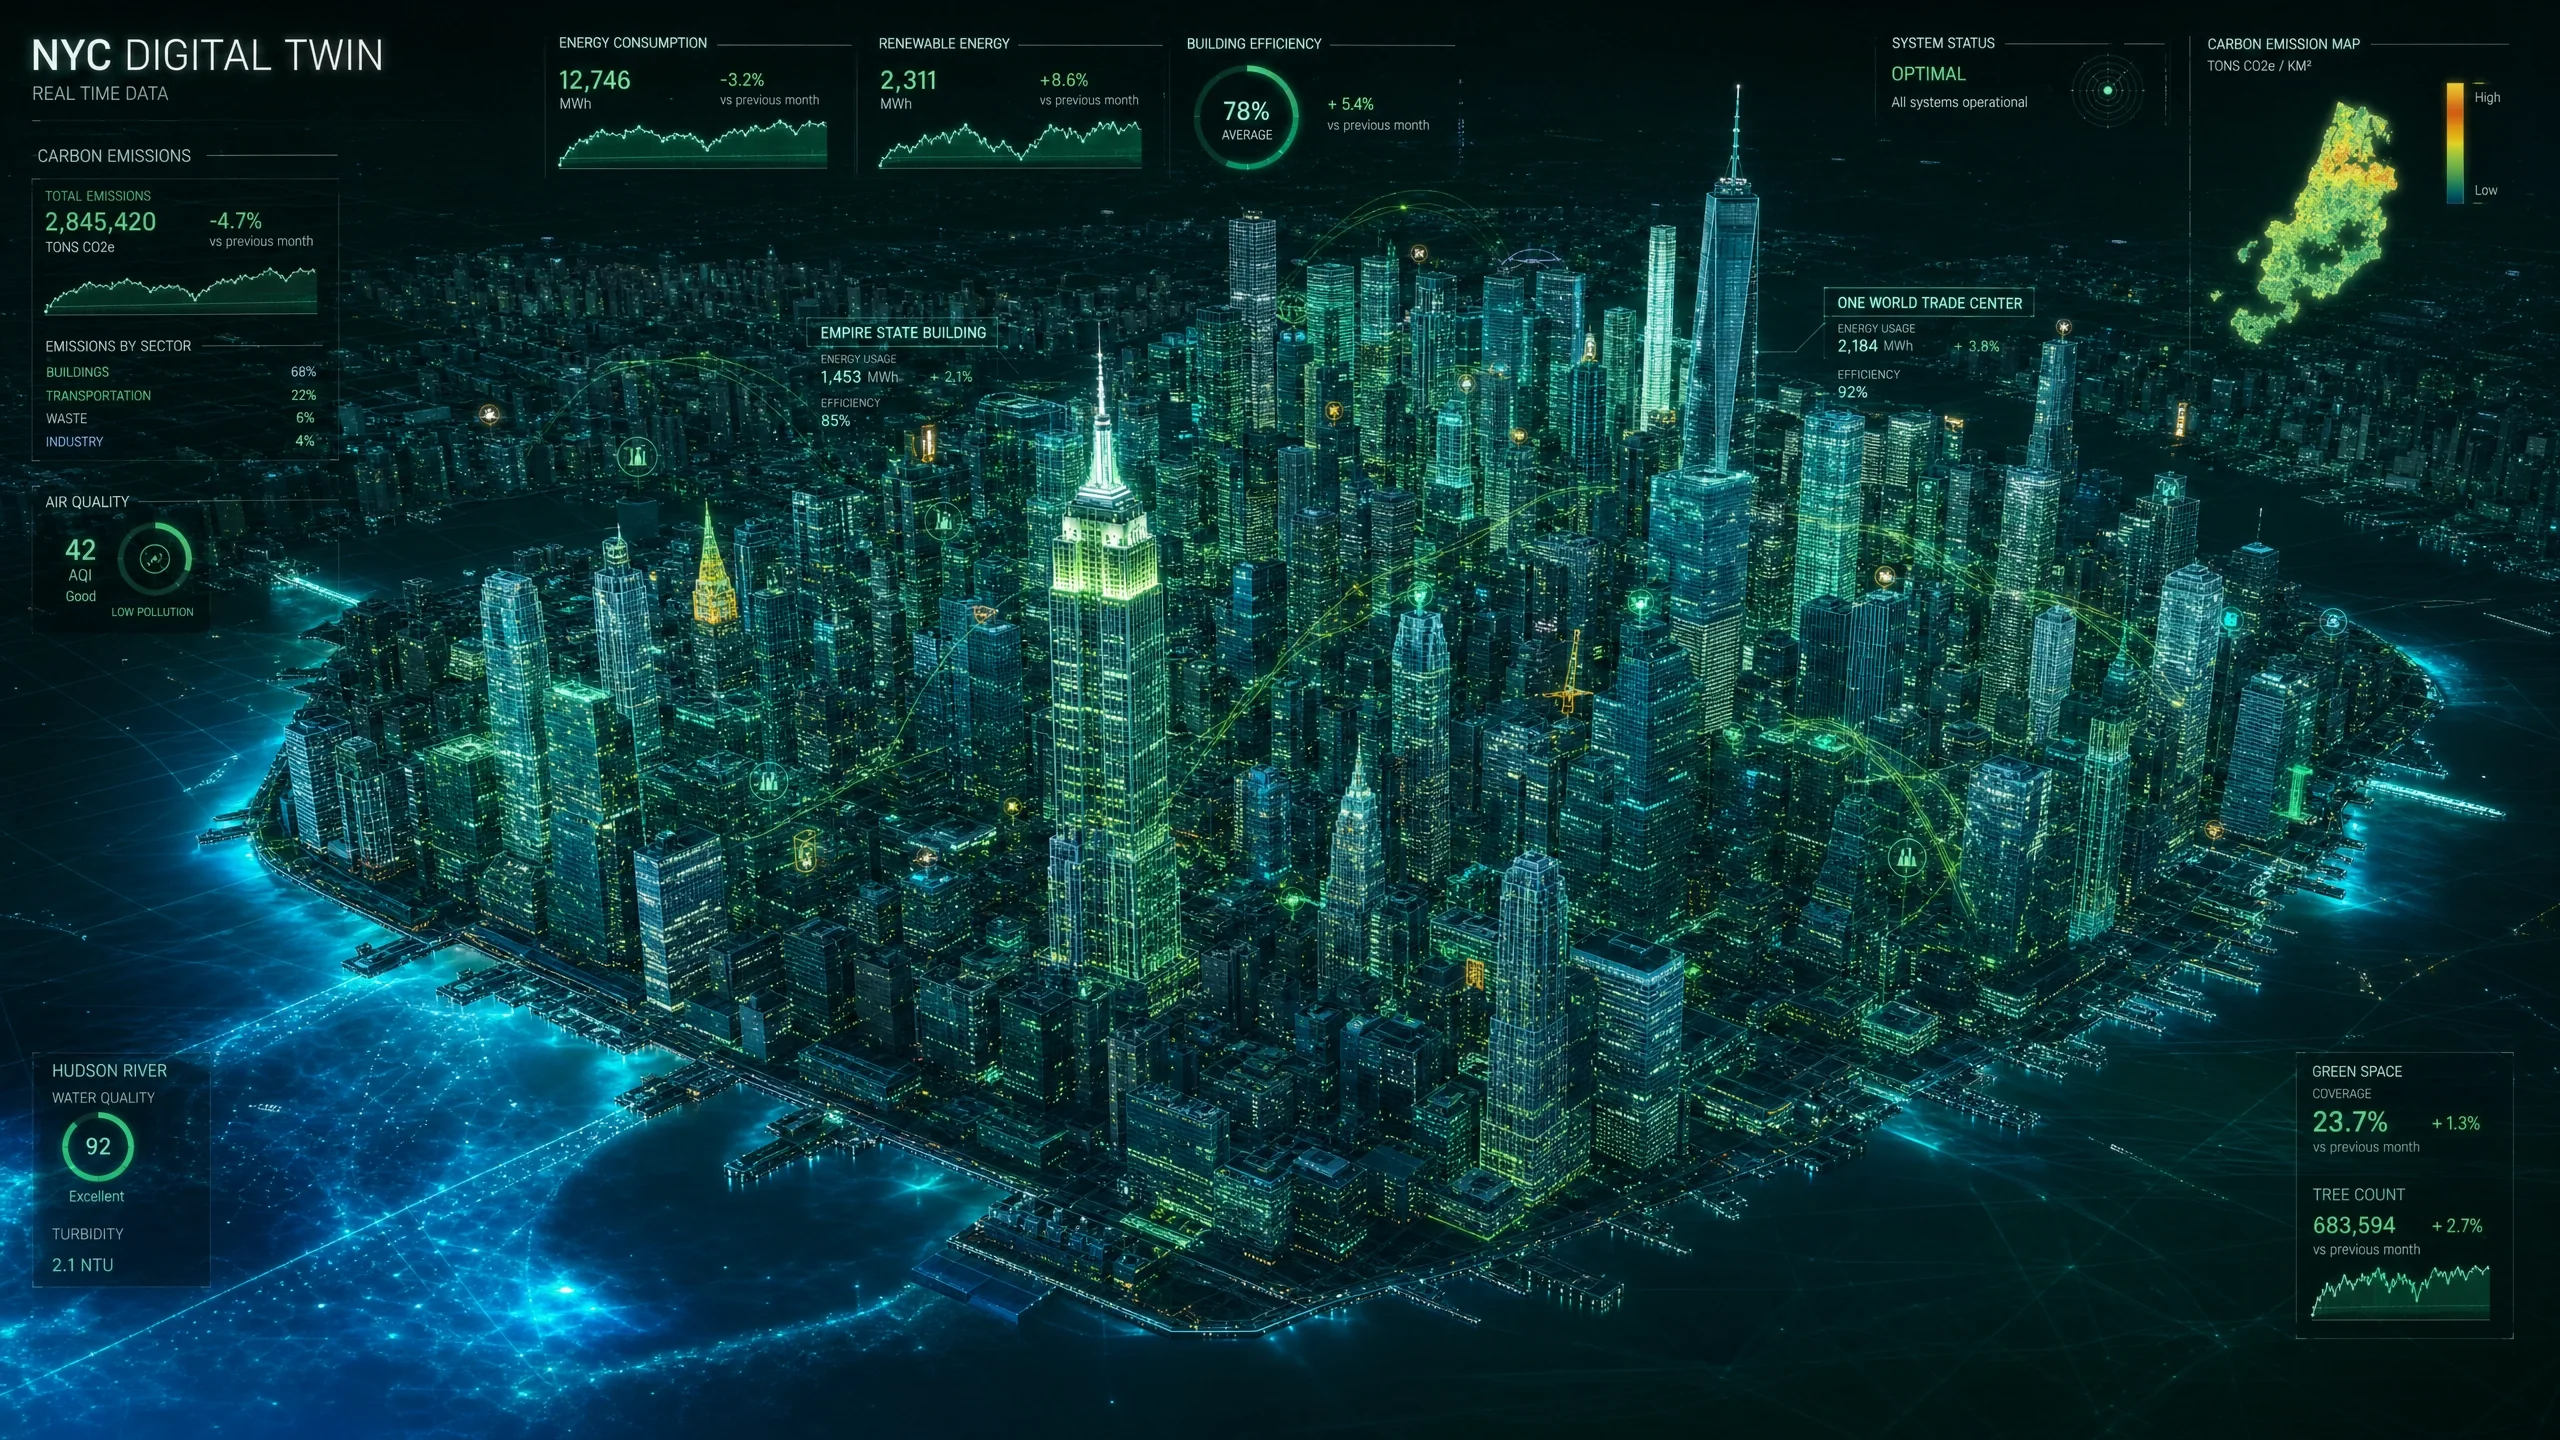
Digital twin rendering of the New York City skyline
Triangle Digital Research, March 2026

New York City Local Law 97: the adoption curve

A data-driven analysis of LL97 compliance from 2024 to 2050, comparing the law as written against a smoothed tightening schedule, and what the difference means for 50,000 buildings, their tenants, and the city.

Key metrics

The scale of the compliance challenge

LL97 applies to roughly 50,000 buildings across the five boroughs. Its phased caps create very different compliance dynamics depending on how the tightening is scheduled.

50,000
buildings covered, over 25,000 sq ft
NYC DOB, 2024
8%
non-compliant today, about 4,000 buildings
Urban Green Council, Dec 2024
+24,500
buildings pushed out of compliance in one year at the 2030 cliff
Triangle Digital analysis
$268
per tCO2e over the limit, every year
NYC Admin Code 28-320
$512M
annual citywide penalty exposure at 2030
Triangle Digital analysis
Compliance timeline

Carbon reduction requirements by phase

LL97 mandates a 40% reduction by 2030 and net zero by 2050 against 2005 baselines. Limits are absolute emissions intensities, not percentage cuts from a building's own history, so older and less efficient buildings face the steepest reductions.

Phase 1
2024 to 2029
21% average cut
about 8% non-compliant
Limit: 0.00846 tCO2e per sq ft (office)
Initial limits take effect. 92% of buildings compliant at launch.
Phase 2
2030 to 2034
40 to 60% cut
about 57% non-compliant
Limit: 0.00453 tCO2e per sq ft (office), 46% tighter
The cliff: allowable intensity drops 40 to 60% overnight.
Phase 3
2035 to 2039
about 72% cut
about 62% non-compliant
Limit: about 0.0030 tCO2e per sq ft (projected)
Deep energy retrofits become necessary.
Phase 4
2040 to 2044
about 81 to 91% cut
about 65 to 68% non-compliant
Limit: about 0.0020 tCO2e per sq ft (projected)
Near net-zero trajectory. Electrification and renewables essential.
Phase 5
2045 to 2049
final approach
declining sharply
Limit: about 0.0010 tCO2e per sq ft (projected)
Residual non-compliance falls away as retrofits accumulate.
Net zero
2050
100% cut
about 5% residual
Limit: zero
Deep retrofits are all that remain.
Building type2024 to 20292030 to 2034Phase 2 cutCumulative vs 20052035 to 2039*2040 to 2049*
Office (B)0.008460.0045346%about 58%about 0.0030about 0.0015
Multifamily (R-2)0.006750.0040740%about 49%about 0.0027about 0.0013
Hotel (R-1)0.012200.0059851%about 60%about 0.0040about 0.0020
Retail (M, A-2)0.010500.0042060%about 65%about 0.0028about 0.0014
Healthcare (I-2)0.021400.0105051%about 56%about 0.0070about 0.0035
Warehouse (S)0.004200.0021050%about 58%about 0.0014about 0.0007

Emissions intensity limits in tCO2e per square foot. Source: NYC Admin Code 28-320; 1 RCNY 103-14; Henderson Engineers (Jan 2024). *Phase 3 to 5 limits are projected from the law's stated 80% by 2050 trajectory; DOB has not published them.

The 2030 cliff is the single most consequential event

The law does not require a uniform percentage reduction from each building's own emissions. It sets an absolute cap that tightens over time. A 1960s office tower burning #4 fuel oil may need to cut actual emissions by 60 to 70% just to meet the 2030 limit, while a modern LEED-certified tower may already comply through 2034 with no changes. The 2030 transition cuts allowable intensity by 40 to 60% in a single year.

Phase rollout

Six phases to net zero

Averaged across each five-year period, the as-written law and a smoothed schedule reach the same footprint by very different roads. The cliff produces four separate shocks; the smoothed curve produces one arc.

Non-compliant buildings by phase, cliff versus smoothed, with the citywide carbon footprint
Left axis: share of covered buildings non-compliant. Right axis: total building-sector footprint, MtCO2e. Sources: Urban Green Council (Dec 2024); NYC Mayor's Office of Climate and Environmental Justice (Sep 2023); Triangle Digital analysis.
0%20%40%60%80%0 Mt20 Mt40 Mt60 Mt7%14%2024 to 202946%40%2030 to 203449%49%2035 to 203950%24%2040 to 204448%9%2045 to 20495%5%2050Cliff, average non-complianceSmoothed, average non-complianceCarbon footprint, MtCO2e
Citywide impact

NYC building-sector emissions, 2024 to 2050

Building-sector emissions decline from the 2024 baseline of 58 MtCO2e as each phase tightens. Corporate tenants acting on their own Scope 3 commitments pull the whole curve forward.

Three scenarios, MtCO2e
The dashed line shows the accelerated path when Fortune 1000 and SBTi-committed tenants cover their own footprints early. Sources: NYC Mayor's Office of Climate and Environmental Justice (2023); Urban Green Council Benchmarking Update (Dec 2024); Triangle Digital analysis.
0153045602024202520302035204020452050Phase 2Phase 3Phase 4Phase 5Net zeroLL97 as written (cliff)LL97 smoothedSmoothed plus Fortune 1000 and SBTiMtCO2e
2024 BASELINE
58.0 MtCO2e

NYC buildings sector

FORTUNE 1000 AND SBTI UPLIFT
+26.7%

Faster reduction than LL97 alone

NET ZERO ONE YEAR EARLIER
2049

With corporate voluntary action

Adoption curve analysis

Cliff versus smoothed, 2024 to 2050

The as-written law creates a market shock at the start of each five-year period. A smoothed approach, 5 to 8% annual tightening, produces one arc that peaks in the late 2030s and declines steadily to net zero.

Share of covered buildings non-compliant, by year
Penalty pool in any year is non-compliant buildings times an average 67 tCO2e excess times $268. Sources: Urban Green Council (Dec 2024); NYC Mayor's Office (Sep 2023); GT Law LL97 analysis (May 2025); NYC DOB; Triangle Digital analysis.
0%20%40%60%80%20242025203020352040204520502030 cliffCliff scenarioSmoothed from 2024Smoothed from 2027
CLIFF SCENARIO

Four separate market shocks

One every five years. Non-compliance jumps from 7% to 57% in a single year at the 2030 threshold, and the peak in each period is higher than the last. Boom and bust cycles make long-term capital planning impossible.

SMOOTHED FROM 2024

A single manageable arc

Non-compliance rises gradually to a peak near 36% around 2037 to 2038, then declines steadily as retrofits accumulate. Both scenarios converge at 5% by 2050.

SMOOTHED FROM 2027

A three-year delayed start

Keeps 2024 to 2026 flat at about 8%, then ramps. Peak shifts to about 38% around 2040, slightly higher and later. The delay costs about three years of early carbon reduction.

Compliance strategy

Smoothing the 2030 cliff

THE CLIFF AS WRITTEN

Sudden 46% drop

  • Limits stay flat until 2029, then drop overnight.
  • Capital shock: a 1M sq ft tower's compliance cost jumps from about $1.2M to about $2.7M in a single year.
  • A rushed, uncoordinated scramble for credits and retrofits in late 2029.
  • Participants concentrate effort on derailing implementation rather than meeting it.
SMOOTHED ADOPTION CURVE

5 to 8% annual tightening

  • Gradual reduction from the 2024 baseline: predictable and manageable.
  • Replaces a capital shock with an escalating operating expense owners can plan.
  • Steady, predictable demand lets institutional credit infrastructure scale.
  • Barbell approach: non-compliant owners on one side, Fortune 500 and SBTi tenants on the other, for market depth.
The liquidity argument

A smoothed program eliminates the $9.3B single-year liquidity shock and creates a stable environment in which institutional-grade carbon assets can be issued, held and retired at scale.

Interactive tool

Run your building

Enter your building's size, type and benchmarked emissions to estimate fine exposure for the two enacted periods, and see how a smoothed annual tightening would change the 2030 number. Enter a credit price of your own to compare against the fine; we do not print one.

Limits per LL97 Table 2 (NYC Admin Code 28-320). Later periods are not yet set in rule and are excluded. Actual fines depend on your DOB filing; this is an estimate. The smoothed column applies a 5% annual tightening from the 2024 limit, the schedule modelled above.

2024 to 2029, as written
Limit
Over the limit
Estimated annual fine
Credit cost at your price
2030 to 2034, as written
Limit
Over the limit
Estimated annual fine
Credit cost at your price
2030, smoothed at 5% a year
Limit
Over the limit
Estimated annual fine
Fine reduction versus the cliff
Policy reform

Improving LL97

Four structural flaws and two expansions that decide whether the program survives contact with the market.

01

Construction cost and time

Building in NYC costs about three times more and takes about three times longer than comparable projects elsewhere in the country, which makes deep retrofits economically prohibitive for many owners. A targeted pathway: NYPA delivers clean electrons to the city by expanding upstate renewable capacity, lowering the capital hurdle for compliance.

02

Reporting disconnect

Reliance on Energy Star creates duplicate reporting against the global GHG Protocol. Energy Star is partial and does not conform to international standards, creating friction for multinational tenants and owners with global ESG obligations.

03

Greenwashing risk

NYC-issued credits carry a real greenwashing risk for the city because they do not factor in electricity reductions. The Comptroller's Cap the Credits report (2024) flagged this as a systemic risk to program integrity.

04

Targeted prioritization

Start with the biggest buildings and worst emitters, such as large accelerated filers, rather than a blanket approach that overwhelms the market. Focus enforcement where the reduction opportunity is greatest.

05

Market adoption

Addressing these flaws is what keeps the program viable. Without credible standards, owners will concentrate their effort on derailing implementation.

06

Scope 3 and the green debt premium

Recognizing verified Scope 3 reductions, tenant commuting, business travel and supply chain, lets buildings and tenants capture a 16 basis point greenium on debt financing. At the scale of the city's commercial portfolio that is hundreds of millions in annual interest, a self-funding compliance flywheel.

Transition strategy

Non-compliant owners, Fortune 1000 and SBTi tenants

The efficient equation: align LL97 compliance with corporate net-zero goals. Value transfers from tenant to owner through one instrument that serves both, and the market has two ends worth about $1.02B a year together.

BUILDING OWNER

Legally on the hook

  • Legally responsible for LL97 compliance and its penalties.
  • Needs capital for retrofits or compliance credits.
  • Wants to hold operating costs down to protect asset value.
FORTUNE 500 AND SBTI TENANT

Committed on Scope 3

  • Aggressive global Scope 3 reduction targets.
  • Needs verified, high-quality credits to meet corporate mandates.
  • Willing to spend on sustainability to satisfy shareholders and staff.
NYC GOVERNMENT

A credible plan, cheaper debt

  • About $197M a year in lower borrowing costs from a 15 basis point greenium on municipal debt tied to verified LL97 progress.
  • A transition plan stakeholders, unions and businesses can align behind.
  • LL97 restructured from a burden into a shared opportunity.
COST SHARING

Every dollar a tenant spends on carbon compliance is one less the owner needs to spend. The incentives align on their own.

DUAL COMPLIANCE

Triangle's verified, regulated assets satisfy the LL97 building requirement and the tenant's corporate Scope 3 mandate at the same time.

GLOBAL PRECEDENT

The same tools are being applied to the EU's Carbon Border Adjustment Mechanism, which validates the approach internationally.

Corporate tenant exposure

Fortune 1000 and SBTi companies in New York

Beyond building owners, major corporate tenants carry independent ESG obligations, which creates a second, voluntary demand stream for compliance assets across hundreds of regulated buildings.

FORTUNE 1000 IN NYC
43
Fortune 500 headquartered in NYC
66
Fortune 1000 headquartered in NYC
200+
additional major offices
  • About 1,200 to 1,500 buildings occupied across the LL97-regulated stock.
  • About 120 to 140M sq ft leased in Manhattan office inventory.

Source: us500.com (Jan 2, 2026); NYC Comptroller Office Market Report (Nov 2025); NYC OSC Office Sector Report.

SBTI-COMMITTED COMPANIES IN NYC
10,000+
validated SBTi targets globally
~300
with a material NYC presence, about 3% of global
~120
Fortune 500 and SBTi overlap in NYC
  • About 400 to 600 buildings occupied across the LL97-regulated stock.
  • About 45 to 68M sq ft leased.
  • Voluntary Scope 3 spend potential about $51M a year at $0.75 per sq ft.

Source: SBTi milestone announcement (Jan 22, 2026); Triangle Digital analysis; NYC office market data.

Combined corporate footprint

Fortune 1000 and SBTi companies together occupy an estimated 165 to 200M sq ft of NYC office space across 1,500 to 2,000 buildings, most of it subject to LL97. Dual motivation: the corporate Scope 3 target and the building's compliance obligation point at the same instrument.

Market sizing

The barbell: two ends, one market

Non-compliant owners driven by penalty avoidance on one side; corporate tenants driven by ESG mandates on the other.

COMPLIANCE-DRIVEN
$900M

Annual citywide penalty pool: 31,500 non-compliant buildings at an average 67 tCO2e excess and the statutory rate.

BARBELL TOTAL
$1.02B
annual addressable market
$248M
Fortune 1000 and SBTi priority segment, compliance plus voluntary spend
ESG-DRIVEN
$124M

Incremental voluntary Scope 3 spend from Fortune 1000 and SBTi-committed tenants: about 165M sq ft of combined unique footprint at $0.75 per sq ft.

Strategic insight

The Fortune 1000 and SBTi segment is about 24% of the market by value and disproportionately valuable: these buyers face the compliance obligation and their own Scope 3 targets at once, and will pay a premium for verified, DABA-registered assets over generic offsets or credits the Comptroller has flagged as a greenwashing risk. One Fortune 1000 tenant relationship can unlock compliance spend across dozens of buildings in its portfolio at the same time.

Partner requirements

Credit partner program

To join Triangle's credit distribution program, partners demonstrate a whole-organization commitment to decarbonization, not just building-level compliance, driven by GHG reporting for consistency.

SCOPE 1 AND 2

Buildings

Partners cover their own direct combustion and purchased electricity across every building in the managed portfolio. GHG Protocol, direct and energy indirect.

SCOPE 3

Employee commuting

Partners account for and cover employee commuting, GHG Protocol Scope 3 Category 7, so the organization's full operational footprint is addressed.

SCOPE 3

Business travel

Partners cover business travel, GHG Protocol Scope 3 Category 6, completing the whole-organization commitment the program requires.

AccentureCBRETurtle
City, state, federal

Connecting the value chain

Three city programs linked into a self-reinforcing framework for energy transition, lower debt cost and resilience: a tri-state regulated and verified environmental credit market for LL97 and for the Scope 3 reporting of Fortune 1000 and SBTi companies.

01, LOCAL LAW 97
~$200M

Debt service benefit

Annual debt service savings from the 15 basis point greenium on NYC municipal bonds, unlocked by verified LL97 compliance and regulated carbon assets.

02, MTA
~$120M

Debt service benefit

Employee commuting and business travel carbon reduction linked to the MTA program unlocks annual debt service savings through green bond pricing.

03, DOT AND CONGESTION PRICING
Carbon discount

On the transaction

Fortune 1000 and SBTi companies pay for the commuting carbon associated with congestion pricing transactions, a discount mechanism that covers the carbon cost. Cost benefit to be determined.

DIGITAL ASSET FINANCE IN NYC

Verified carbon assets underpin a new layer of digital finance infrastructure, linking compliance obligations to tradeable, regulated instruments.

ENERGY TRANSITION AND RESILIENCE

City, state and federal policy in one framework: NYPA clean electrons, LL97 demand reduction and MTA electrification working together.

A BRIDGE BETWEEN ECONOMIC LAYERS

Federal digital asset policy aligned with state power distribution, sharing the cost across the drivers of the state economy: owners, tenants and transit riders.

Join the program

Be part of New York's carbon transition

Triangle Digital is building the tri-state regulated and verified environmental credit market, connecting building owners, Fortune 1000 tenants and city government into one efficient compliance ecosystem.

BUILDING OWNERS

Lower compliance cost and access to green debt financing.

FORTUNE 1000 AND SBTI TENANTS

Satisfy Scope 3 obligations with regulated, verified New York carbon credits.

NYC GOVERNMENT

Capture the municipal debt benefit and align city, state and federal policy.

Q3 2026
program launch
50+ firms
target partners
~$320M / yr
combined benefit
Methodology and sources

Data sources and assumptions

URBAN GREEN COUNCIL BENCHMARKING UPDATE

December 2024. 92% of buildings compliant with the 2024 limits; 43% already meet the 2030 limits; 57% will not without action.

NYC MAYOR'S OFFICE, GHG INVENTORY

September 2023. 63% of large buildings were already exceeding 2030 targets at publication.

GT LAW LL97 ANALYSIS

May 2025. 2024 to 2029 about 11% non-compliant; 2030 to 2034 up to 80% non-compliant with no upgrades; 2035 onward deep retrofits required.

NYC ADMIN CODE 28-320

Local Law 97 of 2019. Penalty $268 per metric ton of CO2e over the applicable limit. Net-zero target 2050.

SBTI MILESTONE ANNOUNCEMENT

January 22, 2026. 10,000 companies globally committed to science-based targets, about 300 estimated to have a material NYC presence.

NYC COMPTROLLER, CAP THE CREDITS

2024. NYC-issued credits present significant greenwashing risk and do not factor in electricity reductions.

KEY ASSUMPTIONS
  • Phase 3 to 5 limits are projected from LL97's stated 80% by 2050 trajectory; DOB has not published them.
  • Penalty pool uses $268 per tCO2e times an average 67 tCO2e excess per non-compliant building, a conservative estimate.
  • The smoothed scenario models 5 to 8% annual tightening with no five-year step changes, analogous to phased SEC disclosure rules.
  • Fortune 1000 NYC office footprint: 43 F500 HQ at about 1M sq ft, 150 F500 satellite offices at about 350K, 66 F1000 HQ at about 500K, 200 F1000 satellite offices at about 200K, about 140M sq ft in total.
  • SBTi NYC presence estimated at about 3% of 10,000 global signatories, about 300 companies at 150K sq ft, about 45M sq ft. Combined unique Fortune 1000 and SBTi footprint about 165M sq ft after about 20M sq ft of overlap. Voluntary Scope 3 market: 165M sq ft at $0.75 per sq ft, about $124M a year.
  • Voluntary Scope 3 spend of $0.75 per sq ft is consistent with voluntary market pricing at the $268 penalty rate.

NYC LL97 analysis, Triangle Digital Research, March 2026. For informational purposes only.

Next step

Get started

Tell us about your situation and we will route it to the right person.